I’ve been trying to sharpen my tools. I’m encouraged to keep going because things are coming back. I’ve got all of these new patterns to: demonstrate, practice, and deep-dive into. This time, I’m looking at metrics with Spring Boot and Micrometer. I’m also using the prometheus rsocket proxy, which is really cool. I’m using gradle this time. Lastly, I’m going to be using Spring Cloud Gateway because it checks a couple of other boxes on my list.
My plan is to setup a simple gateway instance and get some specific metrics. The application will connect to the proxy and deliver its metrics via rsocket. Then I will create a dashboard that displays those metrics in Grafana.
start.spring.io Link to heading
Generate the base, create a git repo.
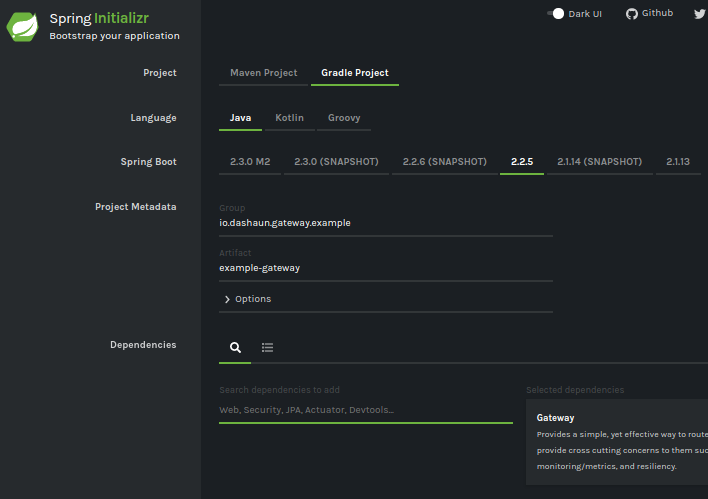
Every time I do this, I just want to connect the dots with my own Initializer. I want to create a repo via initializer instead of downloading a zip and then creating the repo. I won’t tackle that yet.
Add a couple of dependencies Link to heading
Deploy the Monitoring Tools Link to heading
Only 1 tiny node in each AZ for this example.
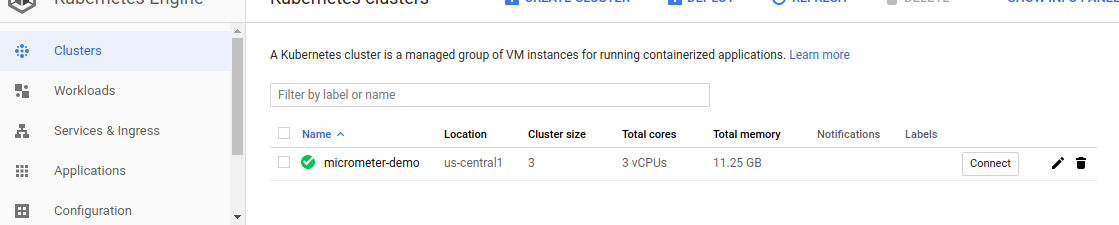
I used GKE this time.
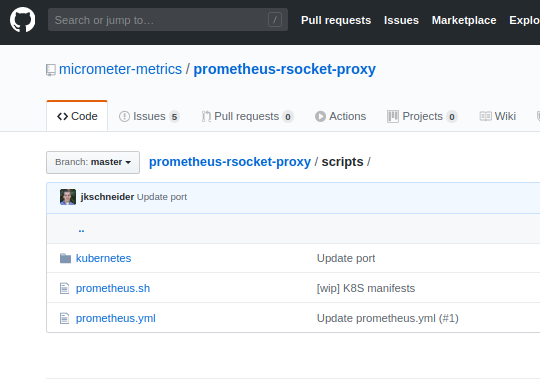
A good friend pointed me at this project, its so easy. All of the k8s yml is right there.
The proxy, Prometheus and Grafana will all be running on a publicly addressable kubernetes cluster. Because of RSocket, I can actually run my application locally, and have Prometheus scrape the application running on my laptop.
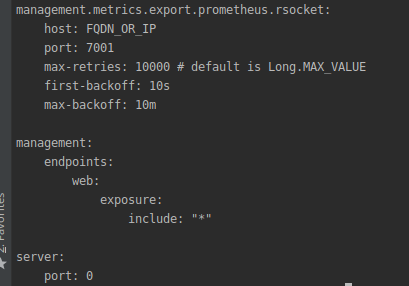
Add some config to tell the app where to send its metrics (sort of) Link to heading
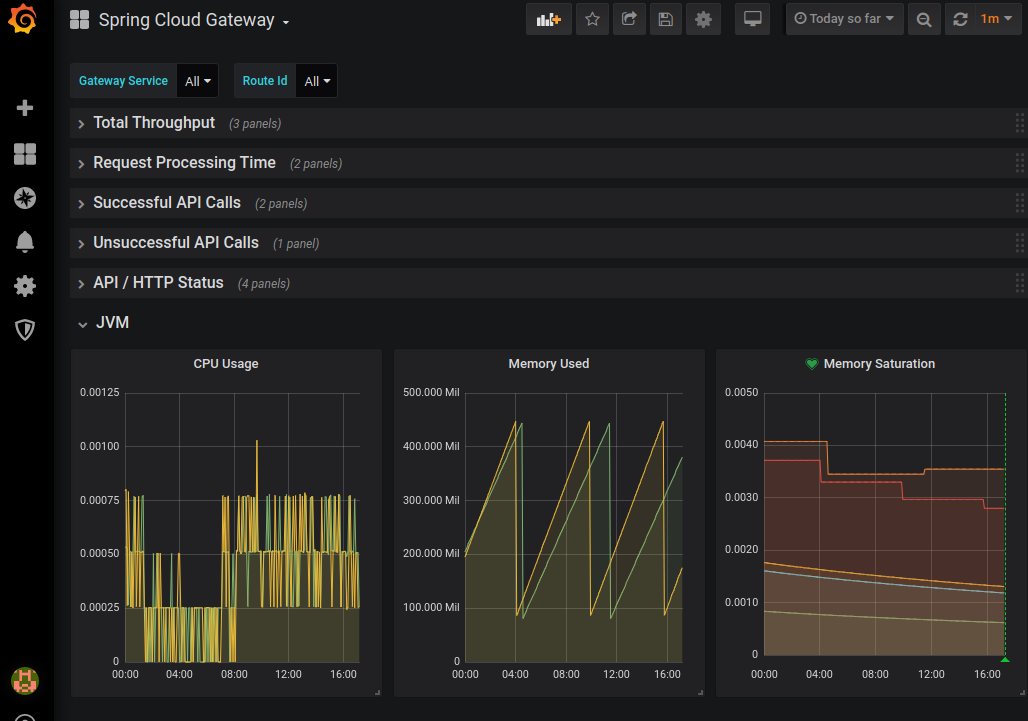
Grab the Grafana dashboard that is packaged with the Spring Cloud Gateway documentation Link to heading
It doesn’t get any better or easier than this. Grafana Dashboard JSON
Summary Link to heading
I like to throw away the first try, and repeat things so they stick. The second attempt took less than 10 minutes, starting from scratch.